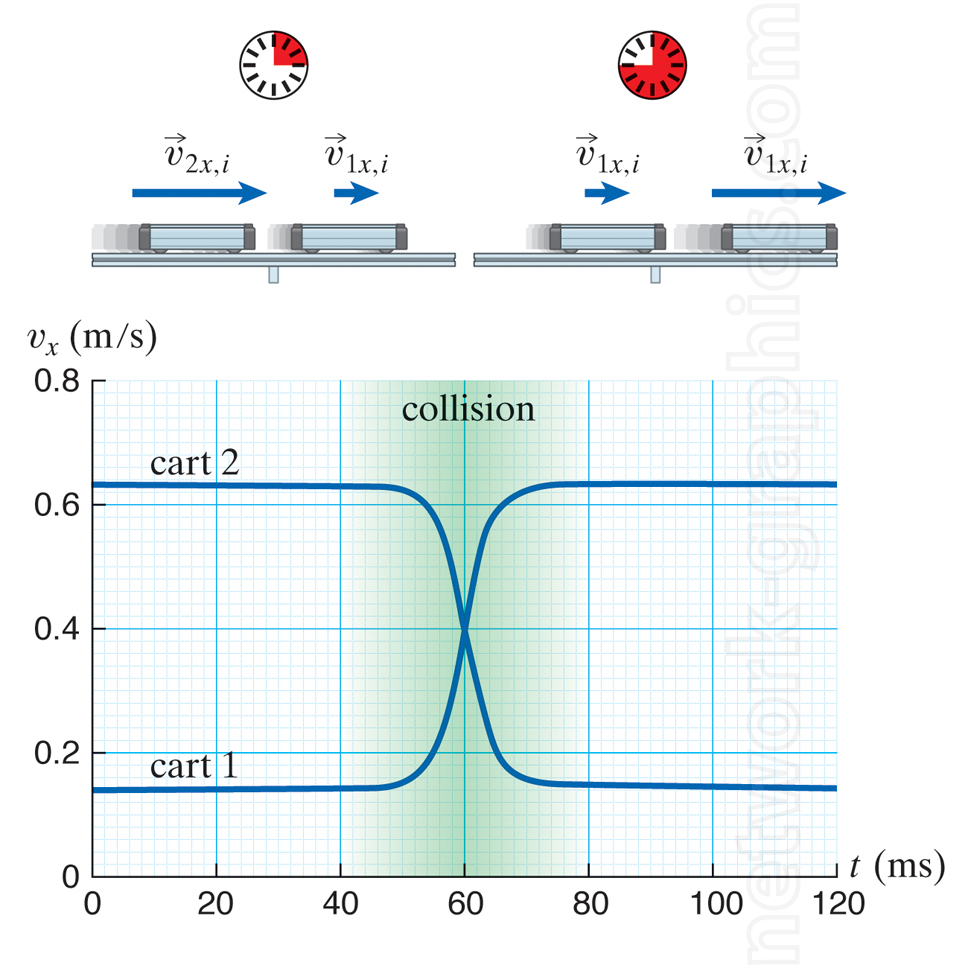
Velocity-Time Graph for Colliding Carts.

This illustration shows the velocity-time graph of two carts before, during, and after a collision on a low-friction track, demonstrating the principles of momentum and energy conservation in physics. Ideal for physics textbooks, the image helps visualize velocity changes during elastic collisions and aids in understanding conservation laws in a one-dimensional system.
We can provide sample images or create custom illustrations tailored to your projects. If you are looking for an illustration of this type, or from another subject area, you can contact us to discuss your needs.
Network Graphics / Division of Abramson & Wickham Graphics Inc.
All rights reserved.

