
The Rise of U.S. Economic Power (1870-1913).
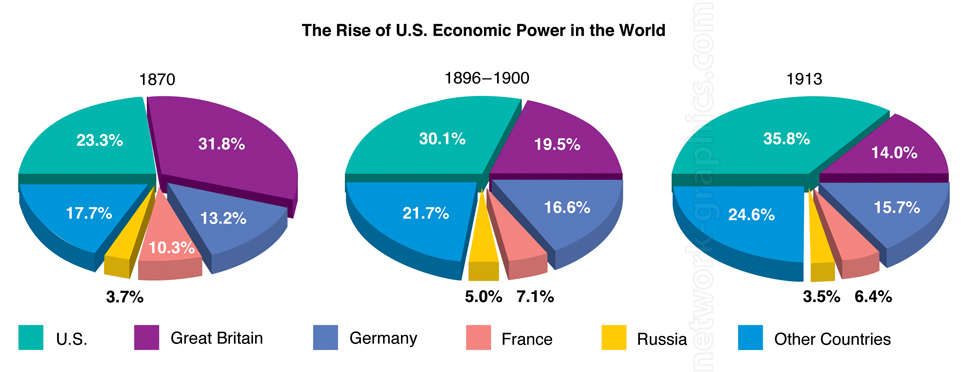
These pie charts illustrate the shifting global economic influence from 1870 to 1913, highlighting the rise of the United States as a dominant economic power. This visual analysis is ideal for history or economics textbooks, helping students understand the changes in global economic leadership over time.
We can provide sample images or create custom illustrations tailored to your projects. If you are looking for an illustration of this type, or from another subject area, you can contact us to discuss your needs.
Network Graphics / Division of Abramson & Wickham Graphics Inc.
All rights reserved.