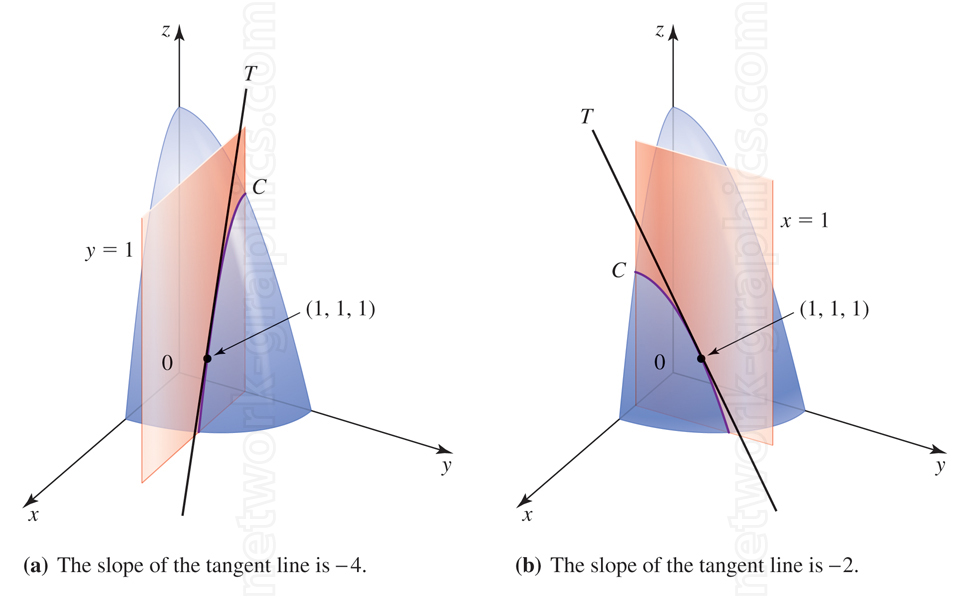
Tangent line slope on a paraboloid.

This diagram illustrates the behavior of tangent lines on a paraboloid surface intersected by planes. In (a), the plane y = 1 intersects the paraboloid at a point where the slope of the tangent line is −4. In (b), the plane x = 1 intersects the paraboloid with a tangent slope of −2. The paraboloid surface is represented in blue, while the intersecting planes are shown in red. The intersection curve C and the tangent lines T at the point (1, 1, 1) demonstrate how the slope changes based on directional constraints along different axes.
This visualization is useful for multivariable calculus, differential geometry, and optimization courses, helping students understand partial derivatives, slopes of tangent lines, and surface-curve intersections.
We can provide sample images or create custom illustrations tailored to your projects. If you are looking for an illustration of this type, or from another subject area, you can contact us to discuss your needs.
Network Graphics / Division of Abramson & Wickham Graphics Inc.
All rights reserved.

