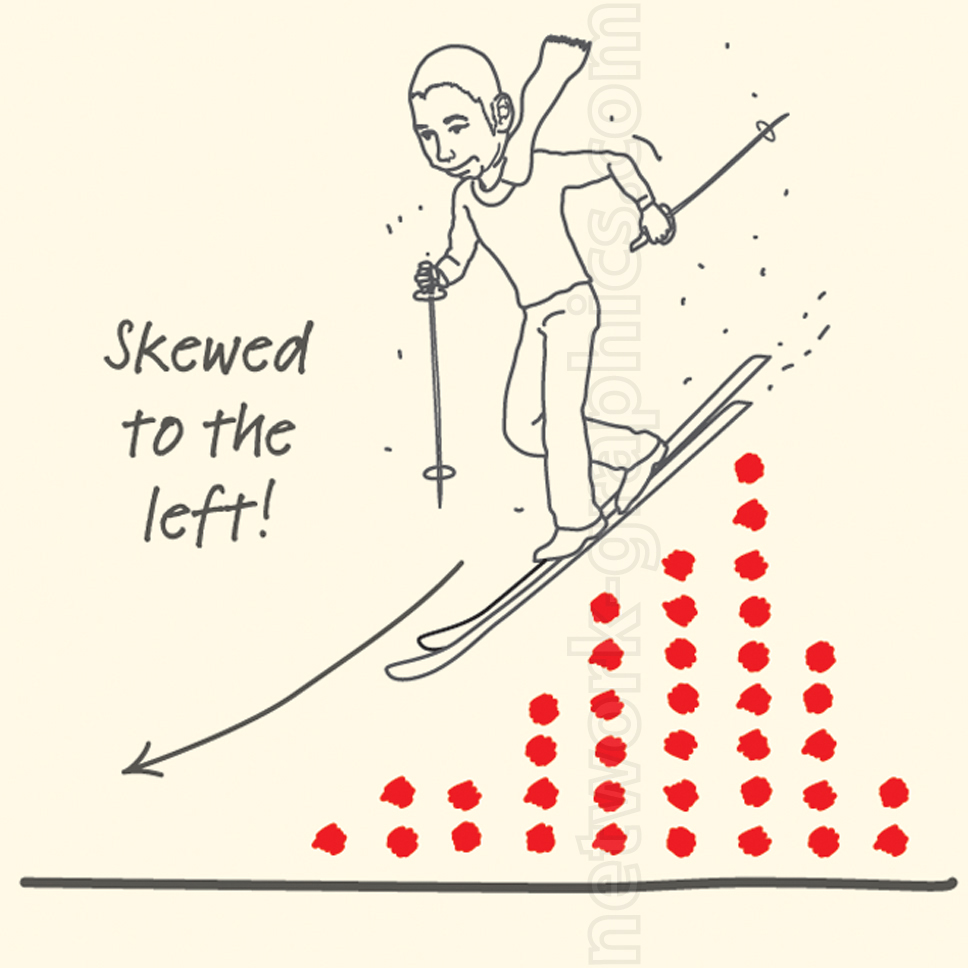
Ski Slope Demonstrates Left-Skewed Data Distribution

This fun and engaging illustration visually explains the concept of a left-skewed data distribution, making it an excellent teaching tool for middle and high school mathematics and statistics textbooks. The use of a skier descending a slope humorously conveys the shape of a skewed data set, reinforcing the idea that more data points are concentrated on the higher end while the tail extends to the left. Perfect for lessons on data analysis and statistical concepts.
We can provide sample images or create custom illustrations tailored to your projects. If you are looking for an illustration of this type, or from another subject area, you can contact us to discuss your needs.
Network Graphics / Division of Abramson & Wickham Graphics Inc.
All rights reserved.

