
Religious Affiliation Distribution: Pie Chart Representation.
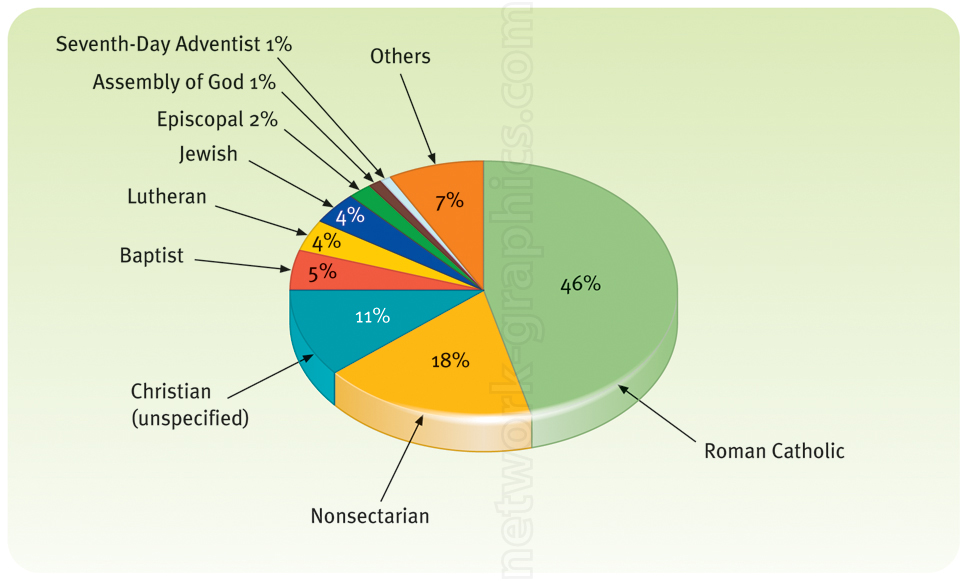
This pie chart illustrates the distribution of various religious affiliations, highlighting the percentages of different faith groups. It serves as a visual aid for sociology or religious studies textbooks, providing insight into religious diversity. This educational resource helps students understand the prevalence of various denominations within a population.
We can provide sample images or create custom illustrations tailored to your projects. If you are looking for an illustration of this type, or from another subject area, you can contact us to discuss your needs.
Network Graphics / Division of Abramson & Wickham Graphics Inc.
All rights reserved.