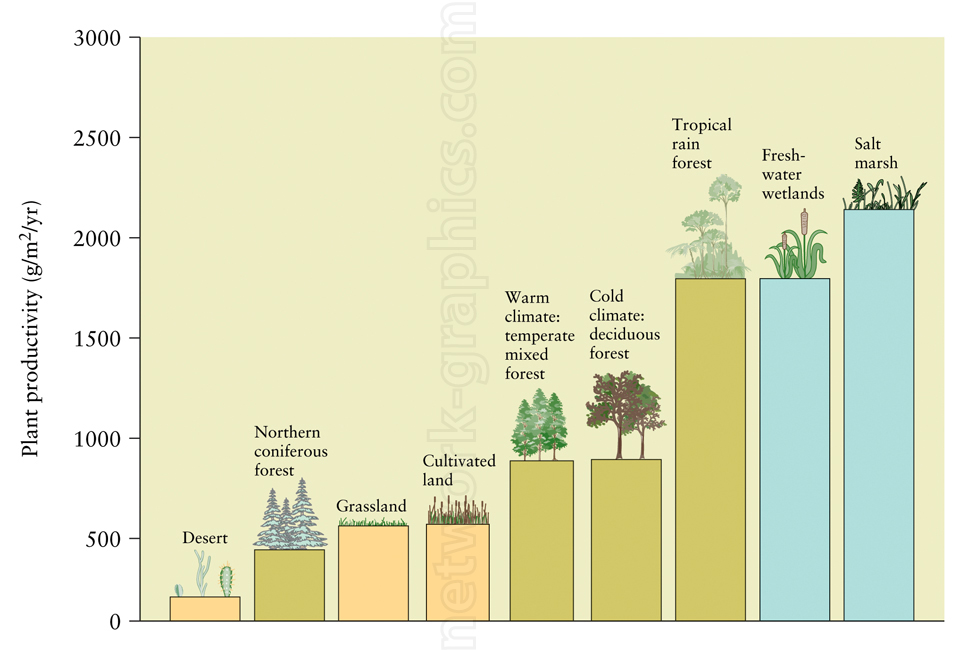
Plant Productivity Across Different Ecosystems.

This chart compares plant productivity across various ecosystems, from deserts to tropical rainforests and salt marshes, making it a valuable resource for elementary to high school biology and environmental science textbooks. It visually illustrates how ecosystems differ in their ability to produce plant biomass, measured in grams per square meter per year, offering students a clear understanding of ecosystem productivity and its relationship to climate and geography.
We can provide sample images or create custom illustrations tailored to your projects. If you are looking for an illustration of this type, or from another subject area, you can contact us to discuss your needs.
Network Graphics / Division of Abramson & Wickham Graphics Inc.
All rights reserved.

