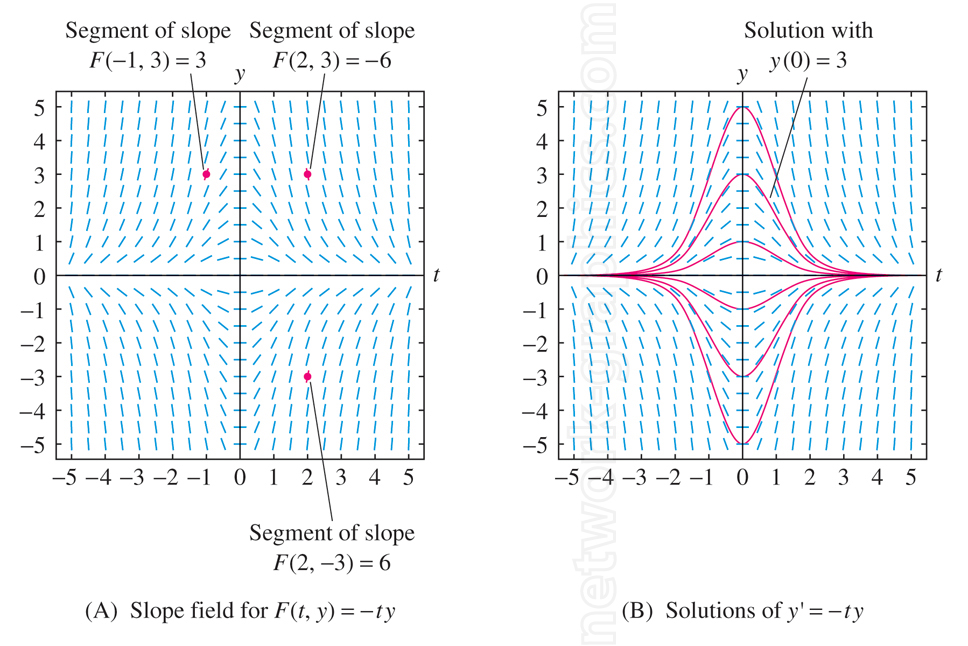
Parabola with slope field.

This image consists of two graphs that visualize the slope field and corresponding solutions of the differential equation y′ = −ty. The graphs illustrate how initial values and slopes interact to generate solutions over time, using both slope segments and full solution curves.
Initial conditions, such as y(0) = 3, generate parabolic-like curves, making this an essential visual for differential equations and calculus concepts.
This illustration is ideal for use in calculus textbooks and online learning materials.
We can provide sample images or create custom illustrations tailored to your projects. If you are looking for an illustration of this type, or from another subject area, you can contact us to discuss your needs.
NETWORK GRAPHICS / Division of Abramson & Wickham Graphics Inc.
All rights reserved

