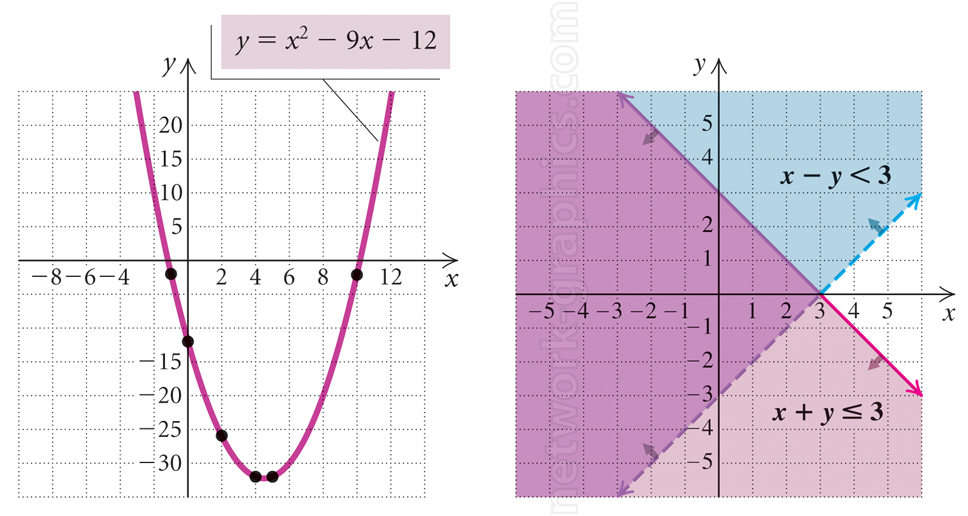
Parabola and inequality shaded regions on grids.

This illustration demonstrates the graph of a quadratic function and the graphical representation of linear inequalities, suitable for algebra and pre-calculus textbooks. It provides a visual approach to understanding parabolic functions, vertex identification, and the solution regions for systems of inequalities.
We can provide sample images or create custom illustrations tailored to your projects. If you are looking for an illustration of this type, or from another subject area, you can contact us to discuss your needs.
Network Graphics / Division of Abramson & Wickham Graphics Inc.
All rights reserved.

