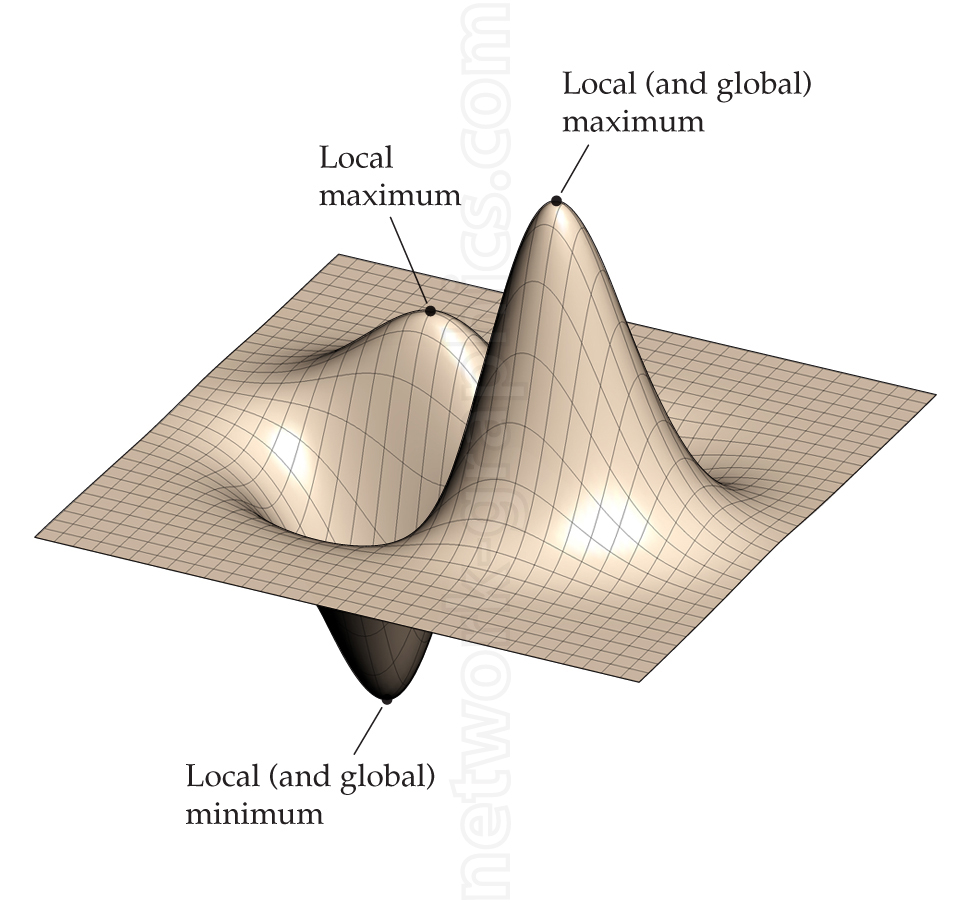
Local and global maximum and minimum points on a 3D surface.

This 3D surface plot showcases the concepts of local and global extrema—including local maximum, local minimum, global maximum, and global minimum—as applied to a multivariable function. It serves as a visual aid for understanding the behavior of functions in three dimensions and the differentiation between local extrema (occurring within small neighborhoods) and global extrema (the absolute highest or lowest values over the entire surface).
Ideal for calculus, multivariable calculus, optimization courses, and machine learning contexts to explain critical points and optimization techniques.
We can provide sample images or create custom illustrations tailored to your projects. If you are looking for an illustration of this type, or from another subject area, you can contact us to discuss your needs.
Network Graphics / Division of Abramson & Wickham Graphics Inc.
All rights reserved.

