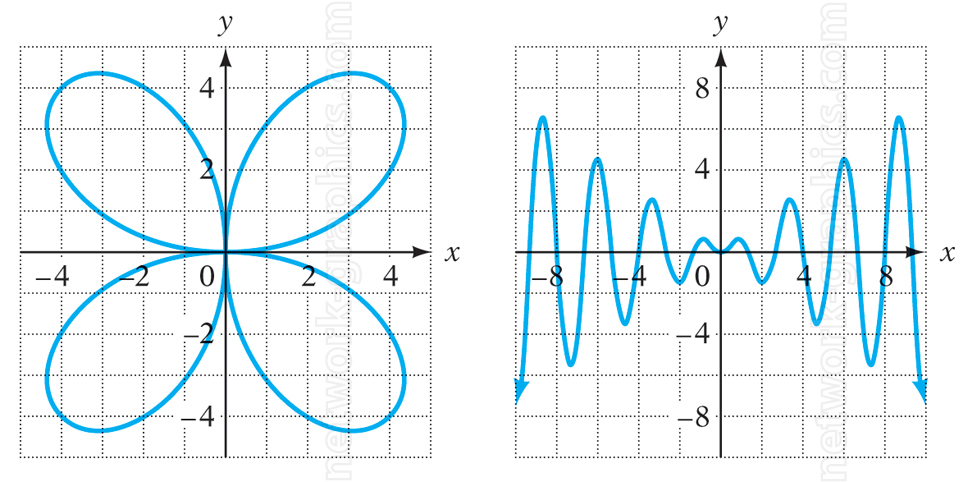
Four petals and trig function in an envelope on grids.

This illustration shows two distinct mathematical graphs: a four-petal rose curve and a wave-like function. The left graph represents a polar equation plotted in the Cartesian plane, forming a symmetrical four-leaf clover shape, while the right graph displays an oscillating function across the x-axis. These visualizations are useful in mathematics textbooks to help students understand the graphical representation of different types of functions.
We can provide sample images or create custom illustrations tailored to your projects. If you are looking for an illustration of this type, or from another subject area, you can contact us to discuss your needs.
Network Graphics / Division of Abramson & Wickham Graphics Inc.
All rights reserved.

