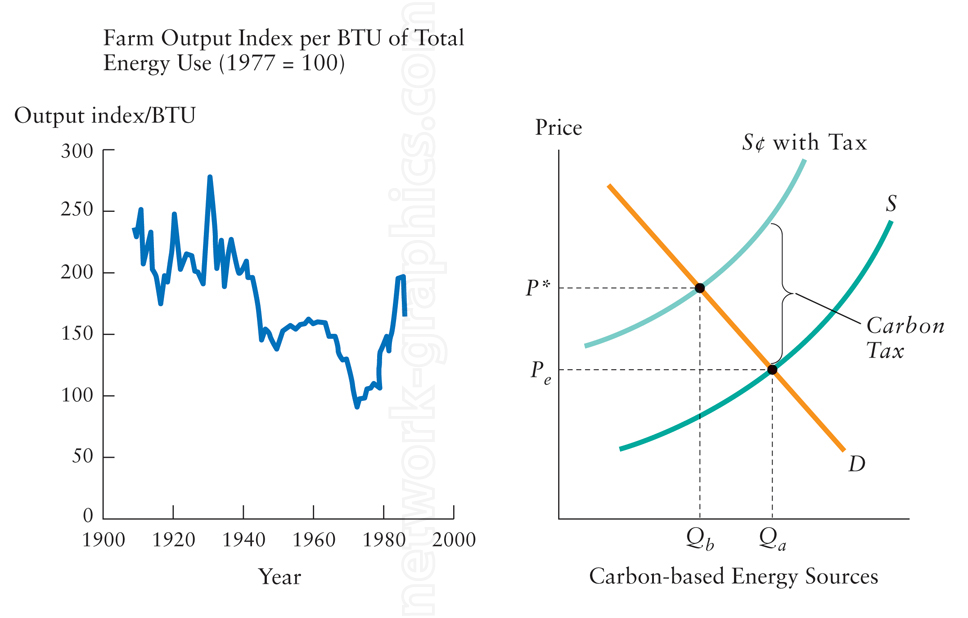
Farm Output Index and Carbon Tax Impact on Energy Pricing.

This dual-panel diagram is useful for economics textbooks, demonstrating two distinct concepts: the historical farm output index per BTU of energy from 1900 to 2000, and the economic impact of a carbon tax on energy prices. It provides valuable insights into agricultural efficiency trends and environmental economics, making it ideal for courses covering sustainability, energy use, and economic policy.
We can provide sample images or create custom illustrations tailored to your projects. If you are looking for an illustration of this type, or from another subject area, you can contact us to discuss your needs.
Network Graphics / Division of Abramson & Wickham Graphics Inc.
All rights reserved.

