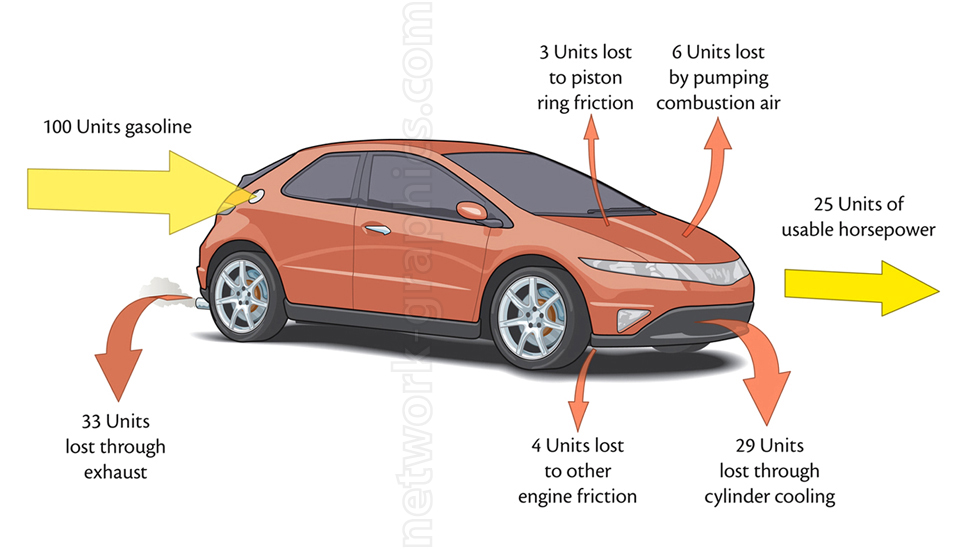
Energy conversion diagram of an internal combustion automobile.

This diagram illustrates the distribution of energy in a car’s internal combustion engine, showing how 100 units of gasoline energy are used and lost across various components. The image highlights energy losses due to exhaust, friction, air pumping, and cooling, leaving a smaller portion as usable horsepower. Ideal for physics or automotive engineering textbooks, this diagram helps students understand energy efficiency and heat loss in mechanical systems.
We can provide sample images or create custom illustrations tailored to your projects. If you are looking for an illustration of this type, or from another subject area, you can contact us to discuss your needs.
Network Graphics / Division of Abramson & Wickham Graphics Inc.
All rights reserved.

