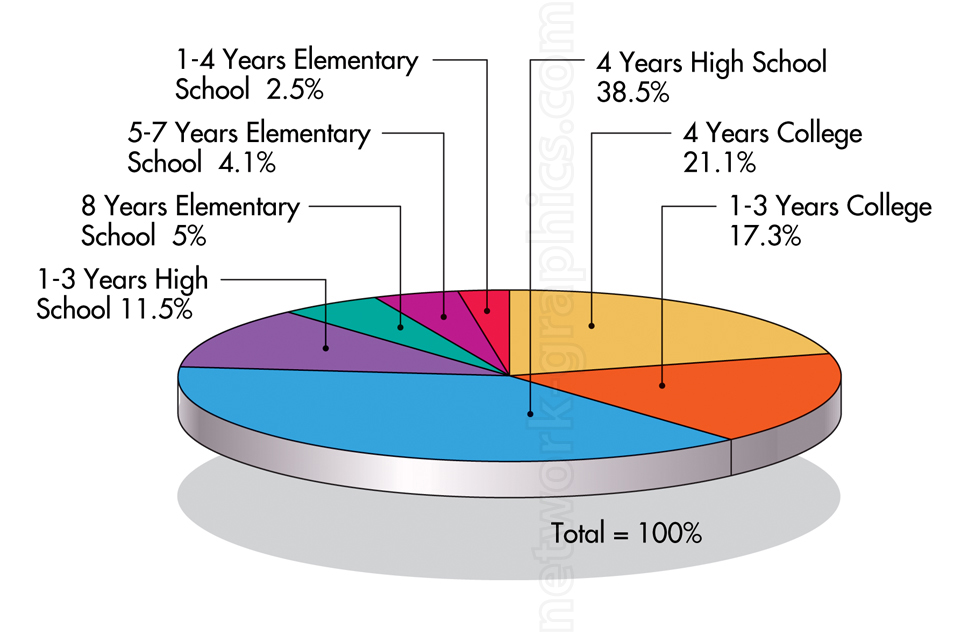
Educational Attainment Distribution Pie Chart.

This pie chart depicts the distribution of educational attainment levels among a population, showcasing the varying years of schooling completed, from elementary to college. It provides insights into the most common education levels, with a significant portion having completed high school and some college education. This visual aid is useful for educational research and social studies textbooks, helping students analyze the diversity in educational backgrounds.
We can provide sample images or create custom illustrations tailored to your projects. If you are looking for an illustration of this type, or from another subject area, you can contact us to discuss your needs.
Network Graphics / Division of Abramson & Wickham Graphics Inc.
All rights reserved.

