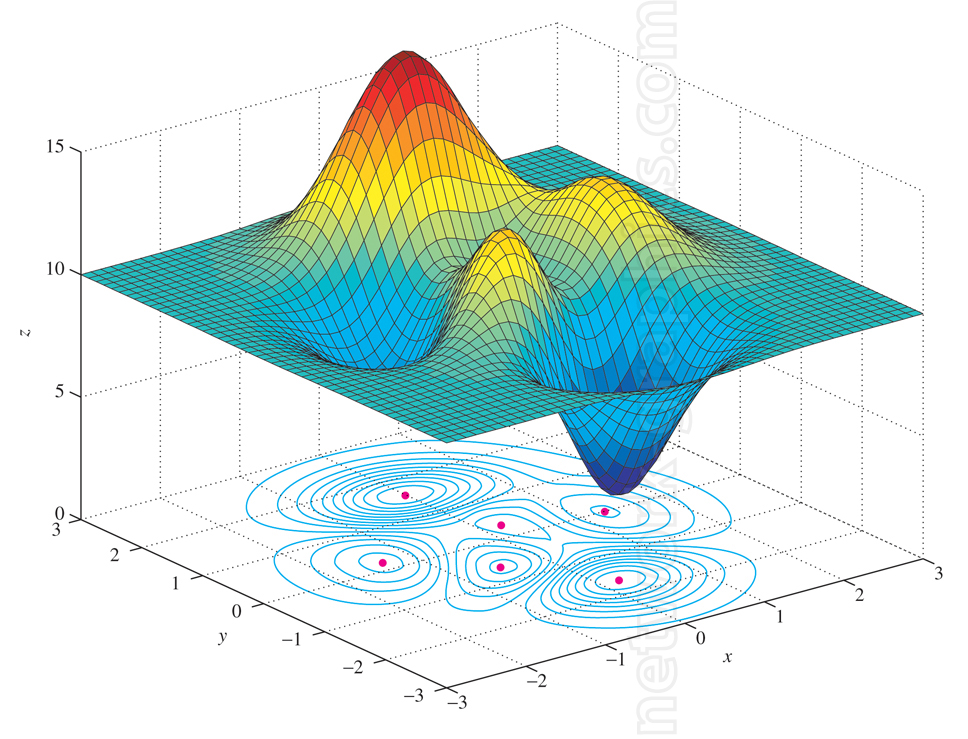
Contour map of 3D surface.

This image features a 3D surface plot combined with a contour map projection on the xy-plane. The surface plot demonstrates a multivariable function with peaks and valleys, rendered using a color gradient to emphasize changes in elevation. Below the surface, the contour map provides a top-down view of the function, marking the same peaks and troughs as level curves.
This illustration is ideal for calculus textbooks and advanced mathematics courses.
We can provide sample images or create custom illustrations tailored to your projects. If you are looking for an illustration of this type, or from another subject area, you can contact us to discuss your needs.
Network Graphics / Division of Abramson & Wickham Graphics Inc.
All rights reserved.

