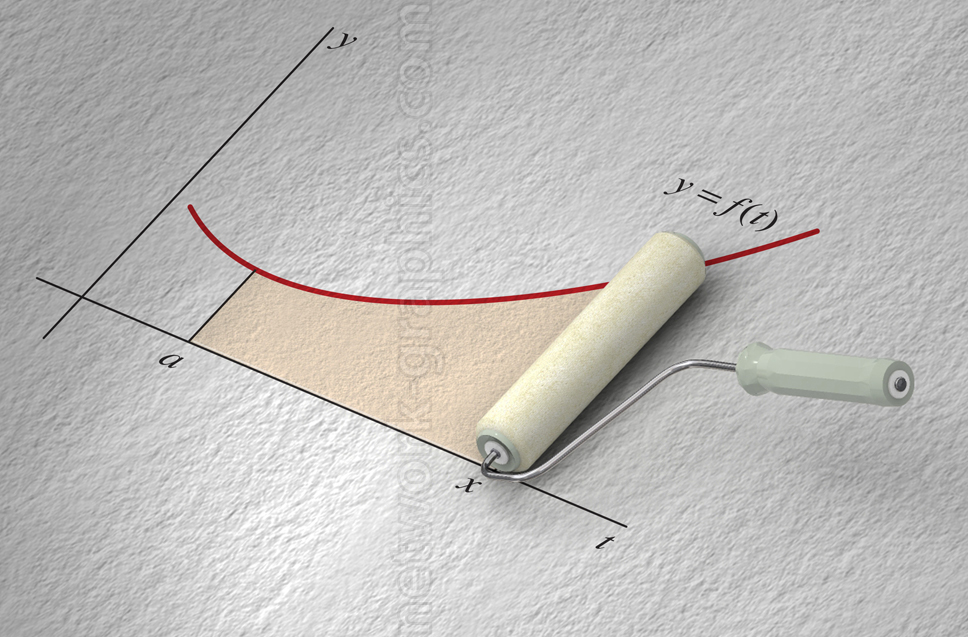
Continuous area under the curve as painted with a roller.

This illustration presents a creative visualization of calculating the area under a curve using a paint roller analogy. The graphic shows a smooth, curved function y = f(t) plotted on a coordinate plane. A paint roller moves horizontally along the x-axis, gradually filling the area beneath the curve with a textured surface.
This illustration is ideal for use in calculus textbooks and online learning materials.
We can provide sample images or create custom illustrations tailored to your projects. If you are looking for an illustration of this type, or from another subject area, you can contact us to discuss your needs.
Network Graphics / Division of Abramson & Wickham Graphics Inc.
All rights reserved.

