
Breakdown of Federal Revenue Sources.
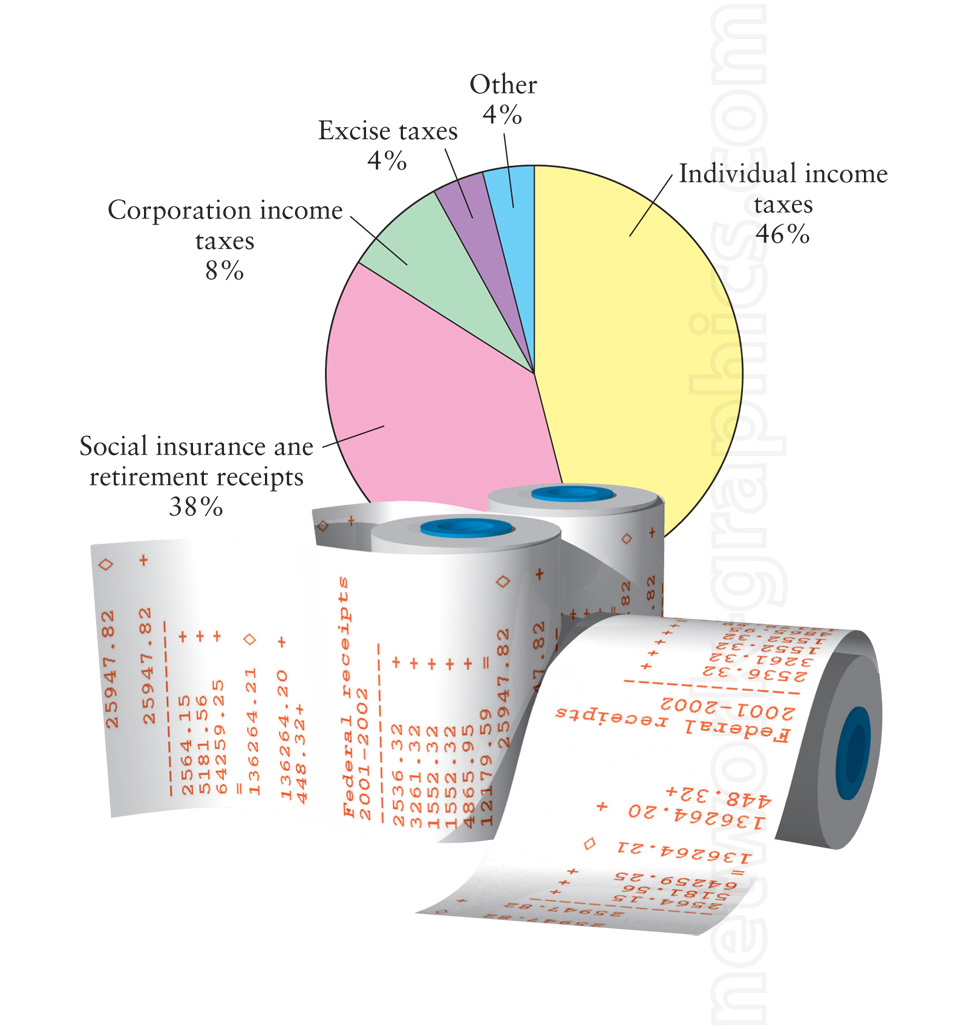
This illustration depicts a pie chart showing the distribution of various sources of federal revenue, including individual income taxes, social insurance, and other taxes. The image provides a visual representation of government funding sources, making it ideal for economics or public finance textbooks to explain federal budgeting and taxation.
We can provide sample images or create custom illustrations tailored to your projects. If you are looking for an illustration of this type, or from another subject area, you can contact us to discuss your needs.
Network Graphics / Division of Abramson & Wickham Graphics Inc.
All rights reserved.