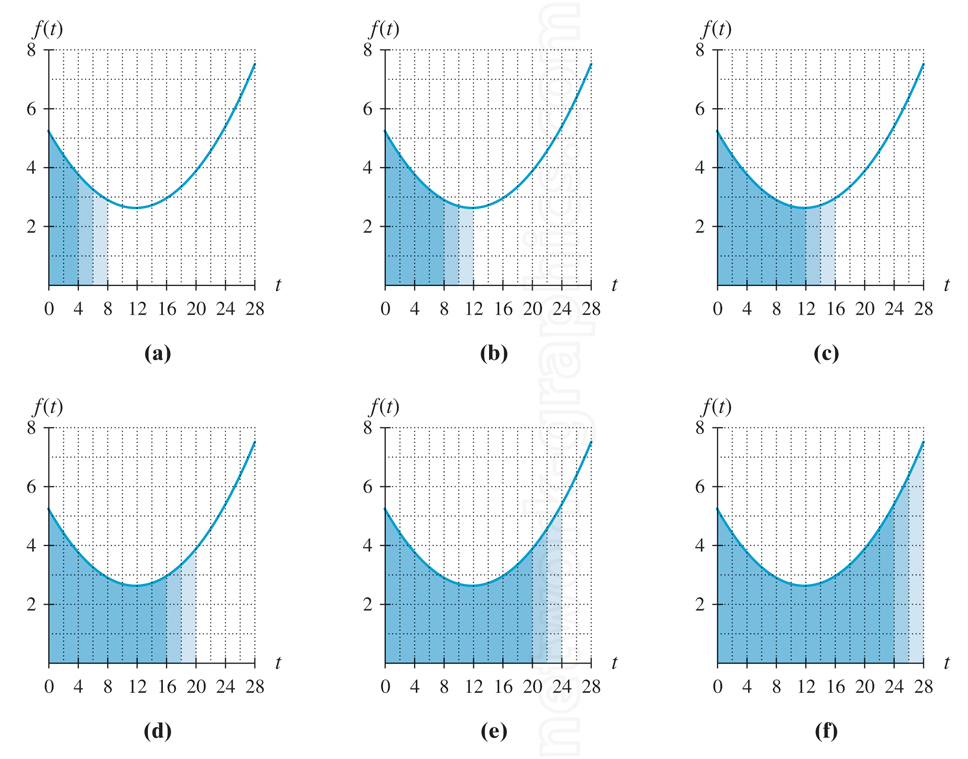
Area under the curve as progressive shaded regions.

These graphs display the area under a curve for varying intervals of the function f(t), providing visual aids for learning definite integrals and calculus concepts. Each subfigure emphasizes different shaded regions, demonstrating the process of calculating the integral over specified time intervals. This set of diagrams is ideal for high school or college-level calculus textbooks.
We can provide sample images or create custom illustrations tailored to your projects. If you are looking for an illustration of this type, or from another subject area, you can contact us to discuss your needs.
Network Graphics / Division of Abramson & Wickham Graphics Inc.
All rights reserved.

