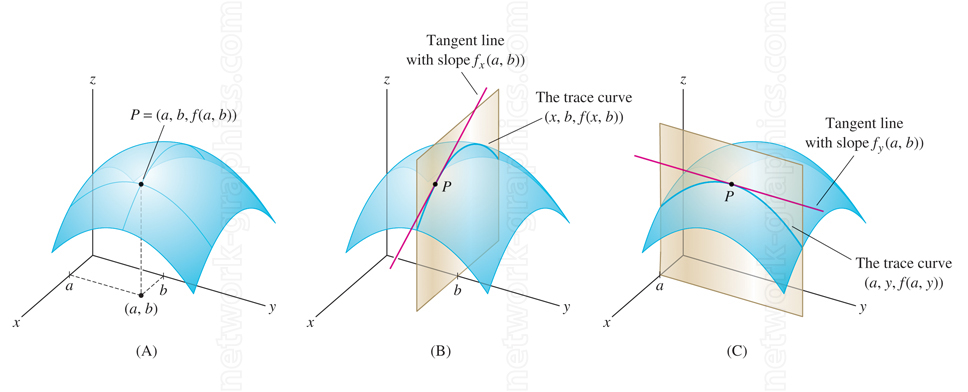
A point, and trace curves projected onto a 3D surface.

This illustration provides a comprehensive view of trace curves, tangent lines, and partial derivatives on a 3D surface. The resulting trace curves reveal the function’s behavior in these specific cross-sections, showing the relationship between changes along the axes and the height of the surface.
This type of visualization of partial derivatives and tangent lines is essential for understanding multivariable calculus concepts, such as optimization, gradient analysis, and surface behavior modeling.
This illustration is well-suited for inclusion in calculus textbooks, mathematical e-books, scientific journals, or classroom presentations.
We can provide sample images or create custom illustrations tailored to your projects. If you are looking for an illustration of this type, or from another subject area, you can contact us to discuss your needs.
Network Graphics / Division of Abramson & Wickham Graphics Inc.
All rights reserved.

