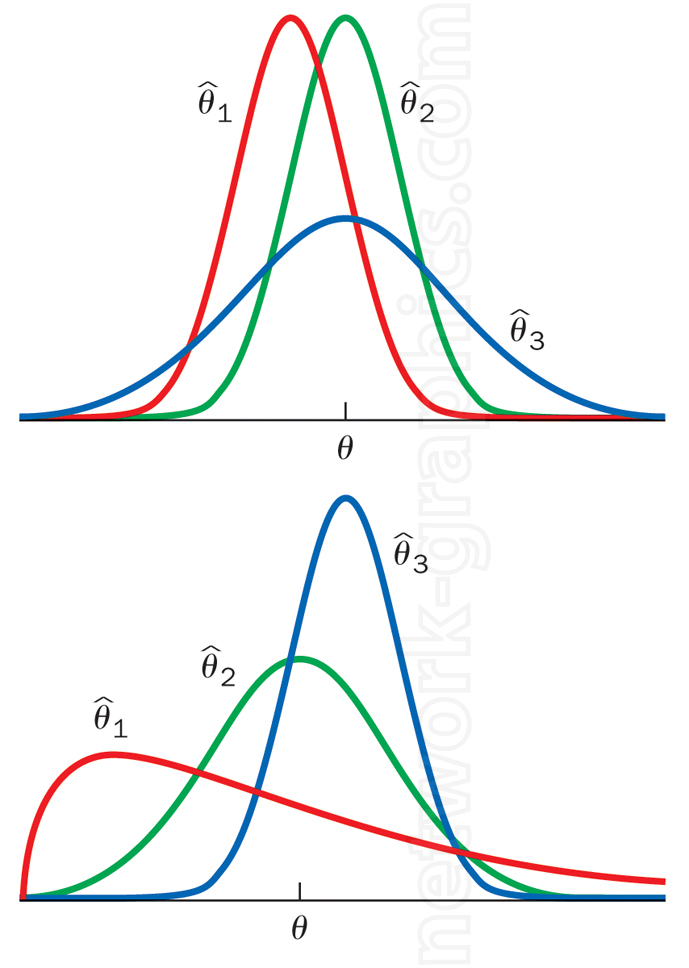
Normal distribution curves and skewed variations.

This image illustrates different probability density functions (PDFs) corresponding to various estimators in statistics textbooks. It is designed to help students understand the characteristics of statistical estimators, including variance and bias, by comparing distributions.
We can provide sample images or create custom illustrations tailored to your projects. If you are looking for an illustration of this type, or from another subject area, you can contact us to discuss your needs.
Network Graphics / Division of Abramson & Wickham Graphics Inc.
All rights reserved.

