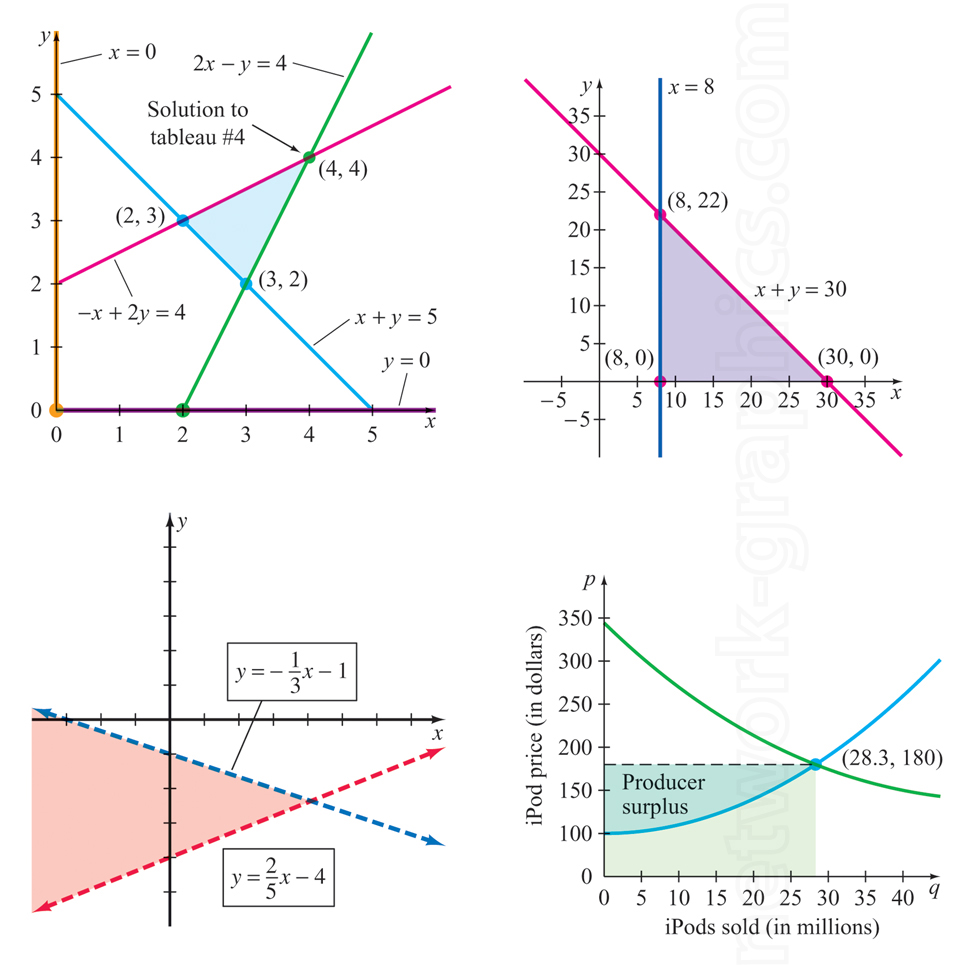
Solution graphs and shaded regions.

This collection of graphs illustrates various mathematical and economic concepts, including linear programming, solution sets of inequalities, and supply and demand curves, commonly found in algebra and economics textbooks. These visualizations help students understand how equations and inequalities represent real-world problems and economic models.
We can provide sample images or create custom illustrations tailored to your projects. If you are looking for an illustration of this type, or from another subject area, you can contact us to discuss your needs.
Network Graphics / Division of Abramson & Wickham Graphics Inc.
All rights reserved.

