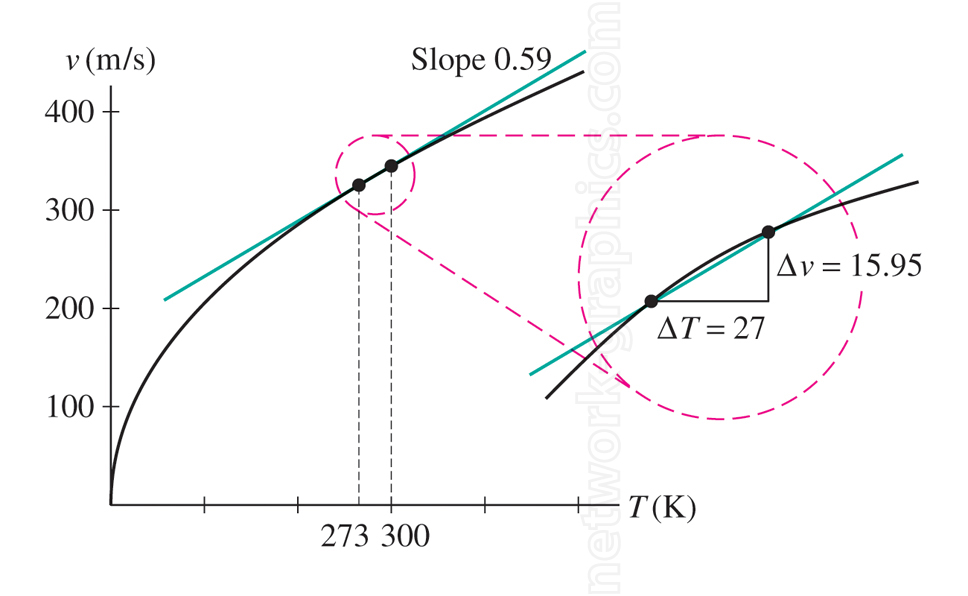
Delta changes in the slope of the tangent.

The graph shows the relationship between velocity v (y-axis) and temperature T (x-axis), with a curve representing their correlation. A tangent line at a specific point on the curve highlights a slope of 0.59, indicating the rate of change in velocity concerning temperature.
We can provide sample images or create custom illustrations tailored to your projects. If you are looking for an illustration of this type, or from another subject area, you can contact us to discuss your needs.
Network Graphics / Division of Abramson & Wickham Graphics Inc.
All rights reserved.

