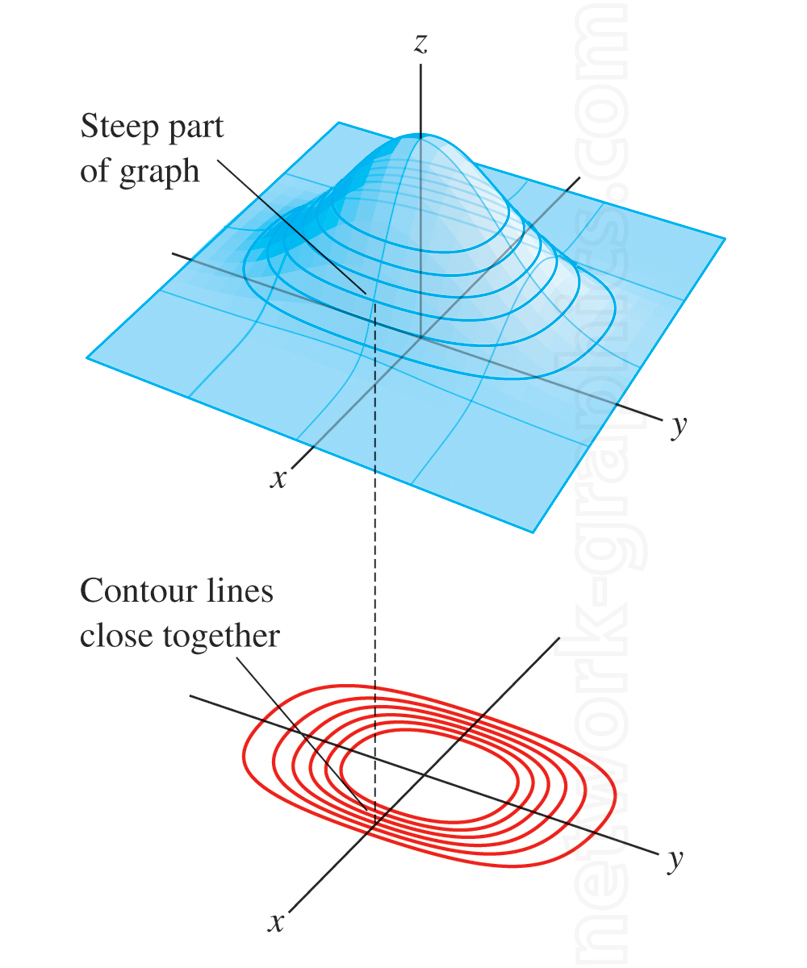
Contour map of a steep hill 3D surface.

The diagram consists of two parts: the upper section shows a 3D surface, with contour lines drawn on it to illustrate a hill or steep region. The lower section shows the same contour lines projected onto the 2D plane. The steep parts of the surface are indicated by contour lines that are closer together. The axes, x, y, and z, are labeled to show the orientation of the surface and the corresponding contour plot.
We can provide sample images or create custom illustrations tailored to your projects. If you are looking for an illustration of this type, or from another subject area, you can contact us to discuss your needs.
Network Graphics / Division of Abramson & Wickham Graphics Inc.
All rights reserved.

