
Economics Graphs Illustrating Productivity and Market Equilibrium.
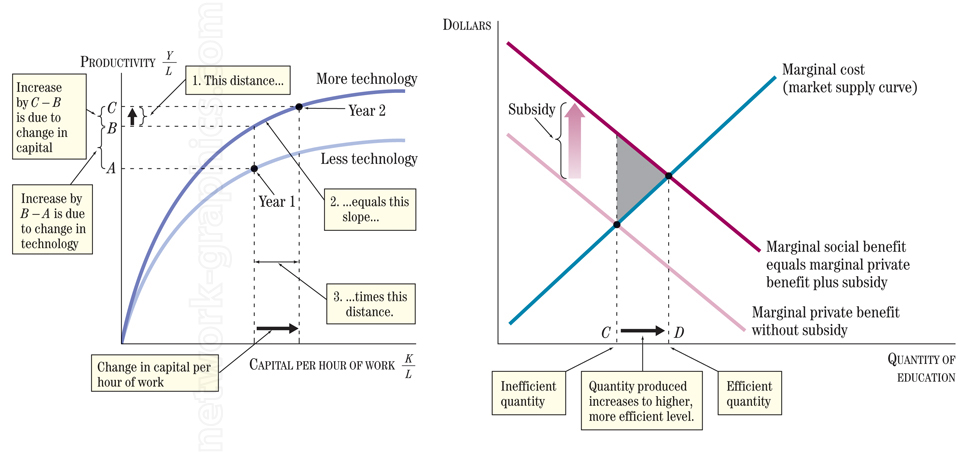
This image provides two detailed economic graphs designed for college-level economics textbooks. It covers key concepts like the relationship between capital, technology, and productivity, as well as the effects of subsidies on market equilibrium for educational services, helping students understand complex economic principles and graphical analysis.
We can provide sample images or create custom illustrations tailored to your projects. If you are looking for an illustration of this type, or from another subject area, you can contact us to discuss your needs.
Network Graphics / Division of Abramson & Wickham Graphics Inc.
All rights reserved.