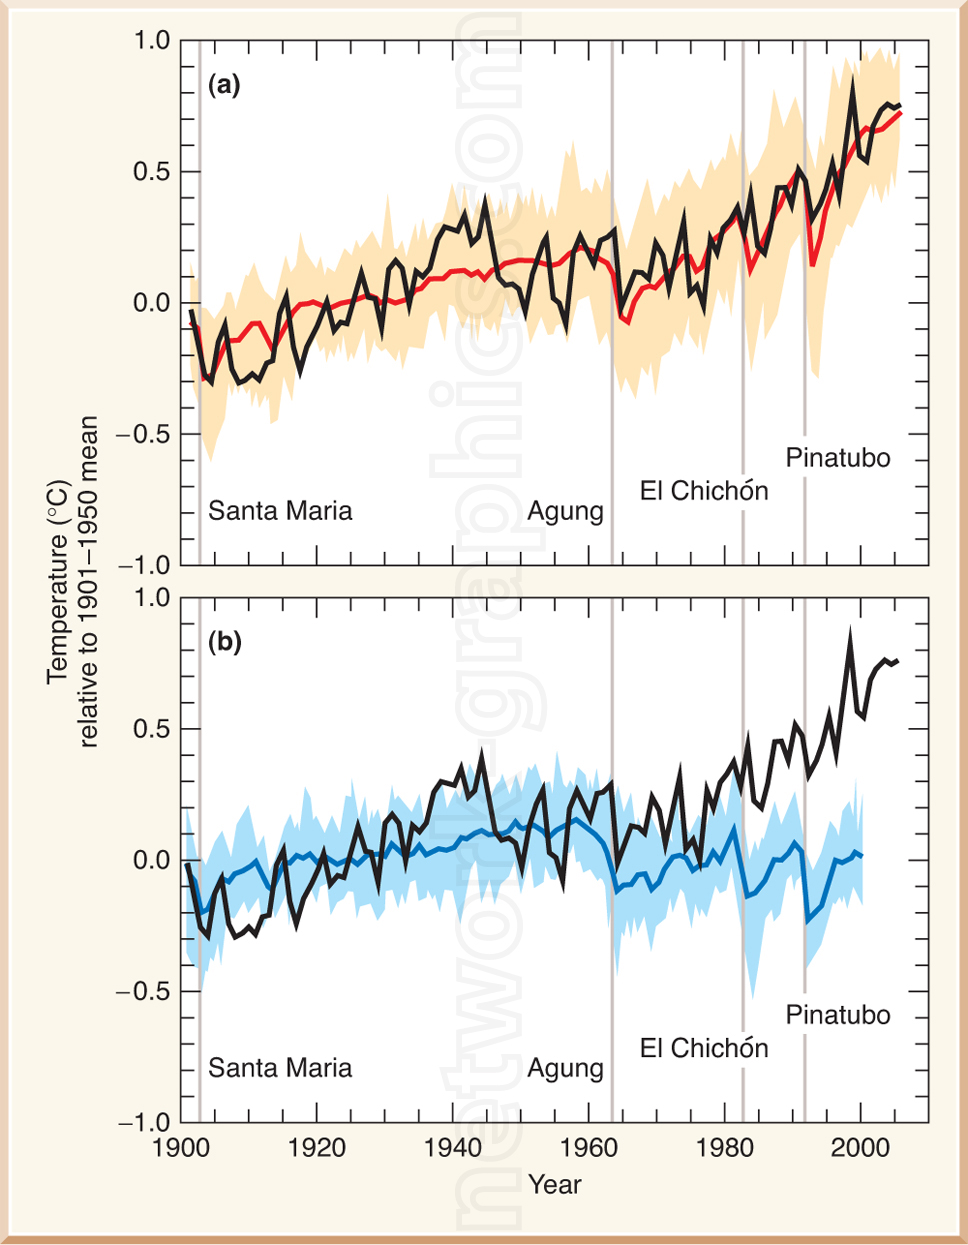
Temperature Changes Relative to 1901–1950 Mean with Volcanic Events.

This comparative graph illustrates global temperature changes relative to the 1901–1950 mean, highlighting the impact of volcanic events such as Santa Maria, Agung, El Chichón, and Pinatubo on the climate. This image is ideal for use in earth science and environmental studies textbooks at the high school and college levels, offering students a visual representation of how natural volcanic events influence global temperature patterns. The graph emphasizes long-term temperature trends and their relationship to volcanic eruptions, essential for lessons on climate change.
We can provide sample images or create custom illustrations tailored to your projects. If you are looking for an illustration of this type, or from another subject area, you can contact us to discuss your needs.
Network Graphics / Division of Abramson & Wickham Graphics Inc.
All rights reserved.

