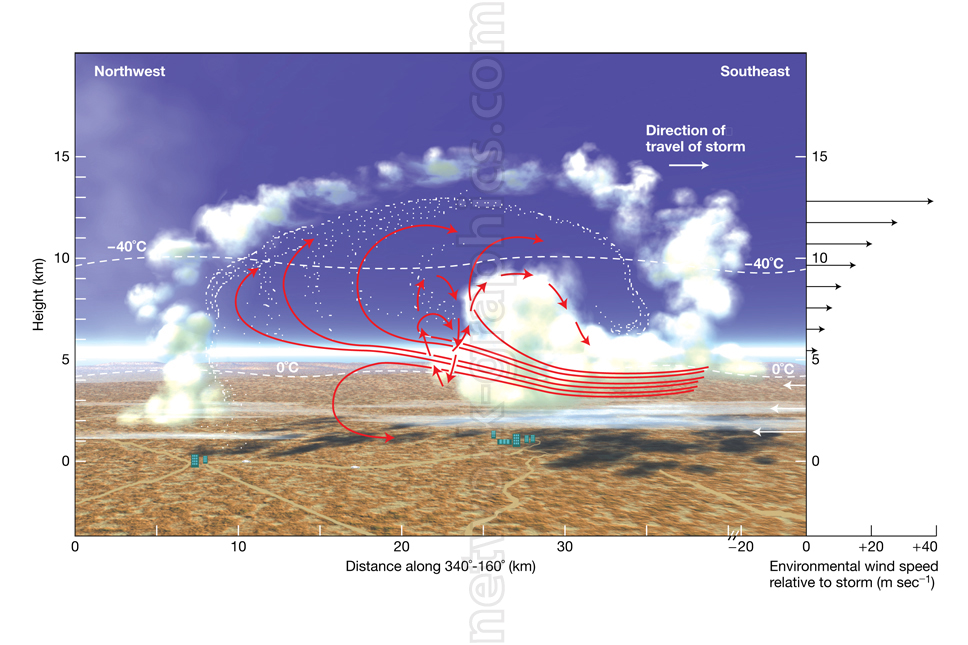
Cross-Section of a Thunderstorm: Airflow and Temperature Profile.

This detailed cross-sectional diagram of a thunderstorm illustrates the movement of airflow and the temperature gradients within the storm, ideal for earth science and meteorology textbooks. The image explains how environmental wind speed, airflow patterns, and temperature variation contribute to storm formation and movement, aiding students in understanding weather systems.
We can provide sample images or create custom illustrations tailored to your projects. If you are looking for an illustration of this type, or from another subject area, you can contact us to discuss your needs.
Network Graphics / Division of Abramson & Wickham Graphics Inc.
All rights reserved.

