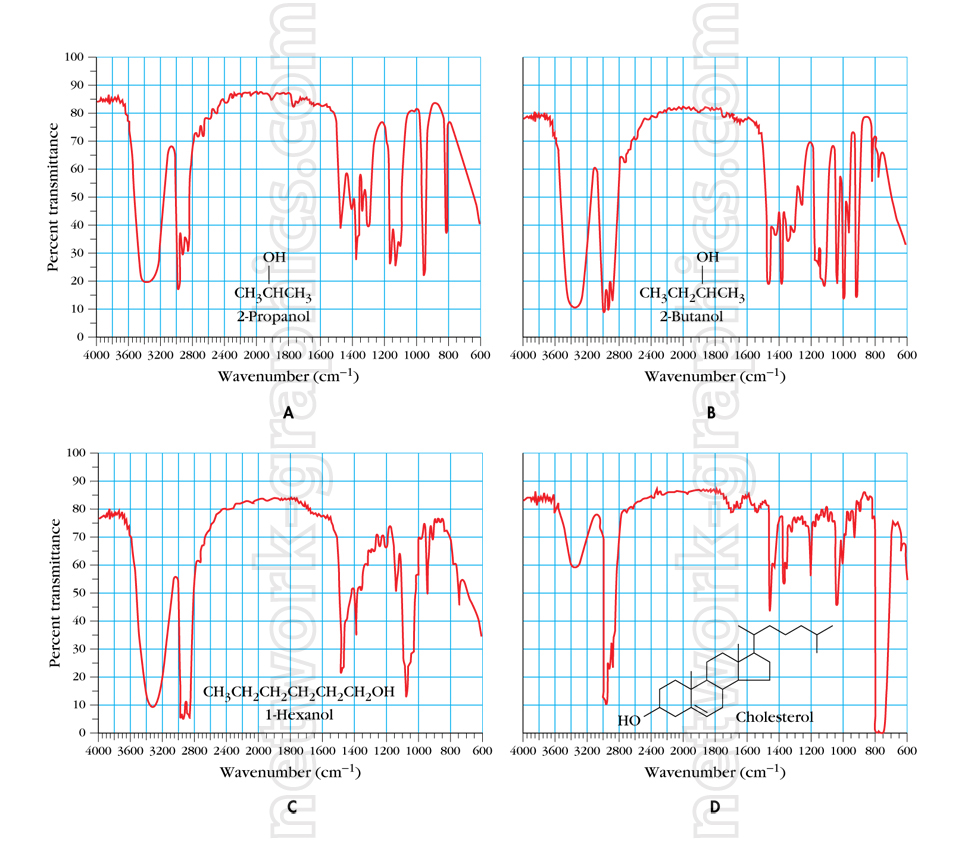
Infrared Spectra of Alcohols and Cholesterol.

This diagram illustrates the infrared (IR) spectra of alcohols and cholesterol, showing the characteristic absorbance patterns of functional groups. Ideal for organic chemistry textbooks, this image helps students visualize how different molecular structures, such as hydroxyl groups, produce distinct IR spectra. Understanding IR spectroscopy is essential for identifying organic compounds and analyzing their functional groups in various academic and research settings.
We can provide sample images or create custom illustrations tailored to your projects. If you are looking for an illustration of this type, or from another subject area, you can contact us to discuss your needs.
Network Graphics / Division of Abramson & Wickham Graphics Inc.
All rights reserved.

